%20-%20WO%20BG.png)
The 1929/2000 Signal is Back after +20% in 4 weeks on S&P 500
- Nico DE BONY
.jpg/v1/fill/w_320,h_320/file.jpg)
- May 19
- 5 min read
YouTube video published on 2026/05/18
This weekly briefing is also available in podcast formats on your favorite platforms (YouTube, Spotify, Apple Podcasts, etc.).
Executive Summary: Anatomy of a Mechanical Top
The stock market is currently navigating an extreme phase of euphoria that demands rigorous investor vigilance. While the S&P 500 continues to string together new record highs, a deep dive into technical, macroeconomic, and mechanical indicators reveals a total and dangerous disconnection from real-world economic conditions.
This monthly briefing deconstructs mainstream consensus and highlights the true driving forces behind this market regime to help you avoid the pitfalls of FOMO (buying under pressure) or panic-selling.
1. Deconstructing Wall Street Myths
The Fake 300-Year Signal: Recent reports from major institutions (such as Bank of America) claiming that we are experiencing a historical anomaly unseen since the 1720 Mississippi Company bubble are misleading. By comparing the broad Nasdaq index in the year 2000 to today's ultra-concentrated Semiconductor (SOX) ETF, these reports manipulate the data. A rigorous, apples-to-apples comparison shows that the semiconductor sector was actually twice as extended relative to its 200-day moving average in the year 2000 (102%) than it is today (62%).
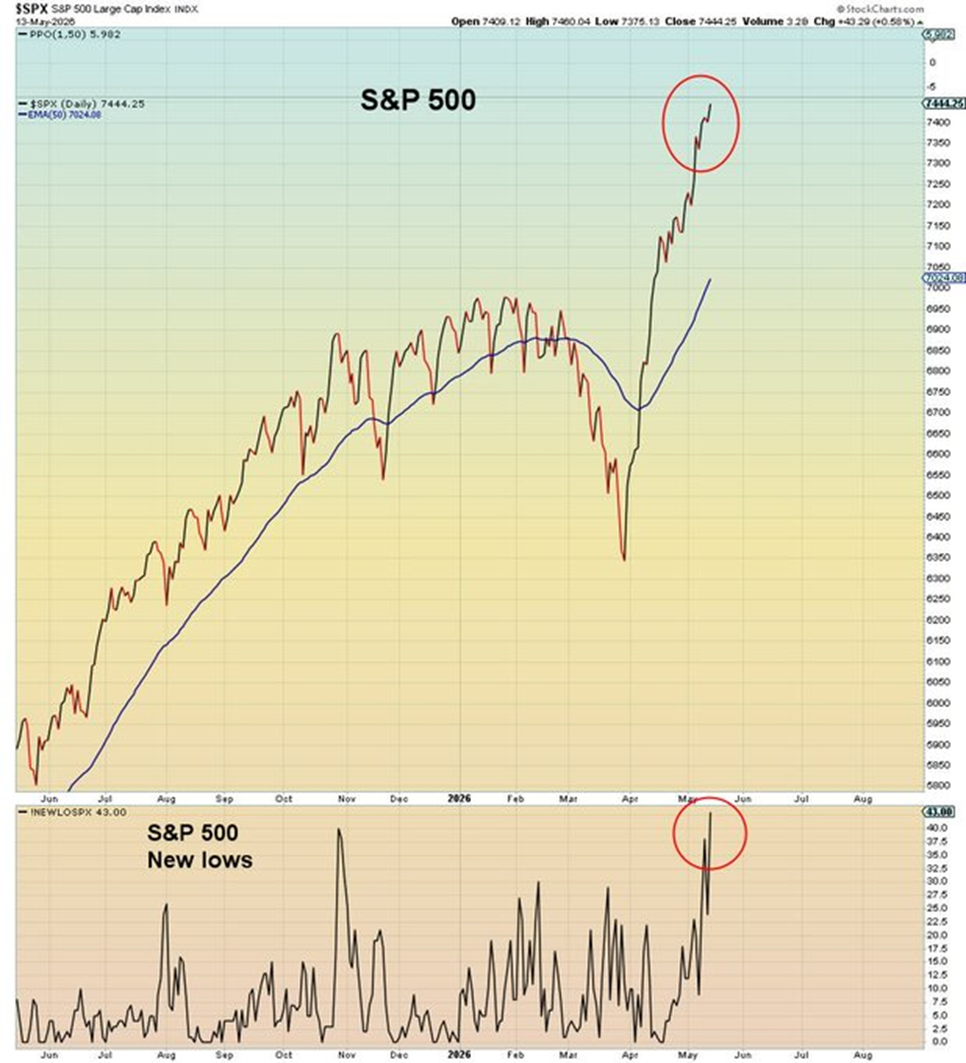
The 1929/2000 Signal is Real: While the 300-year anomaly is a myth, another major historical signal has triggered: the S&P 500 has surged 20% in the span of 4 weeks. Historically, such a violent vertical impulse has only occurred twice before: right before the peak of the Dot-Com bubble in 2000 and a few months ahead of the 1929 crash.
2. Signs of Technical and Mechanical Exhaustion
A Purely Artificial Rally: This rebound is not supported by organic fundamentals, but by a strict mechanical dynamic (systematic inflows from 401ks, CTA trend-following rebalancing, and volatility-targeting models), all amplified by a massive gamma squeeze that is now running out of steam.
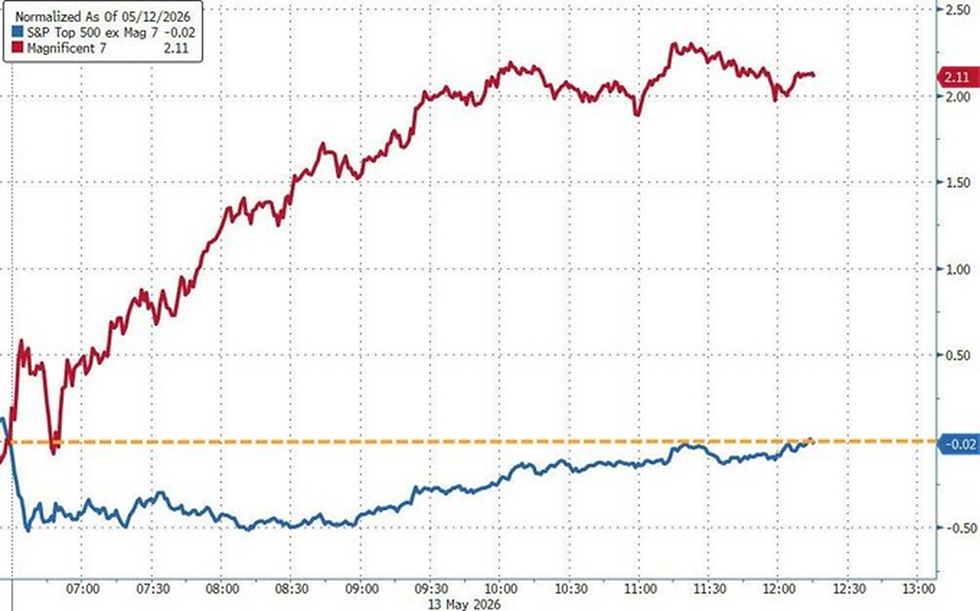
Terminal Concentration: The market is only moving higher because of a handful of stocks. During recent all-time highs for the S&P 500, only the "Magnificent 7" were holding the index up (+2% on average), while the remaining 493 stocks closed in negative territory.
Participation Deficit & Record Leverage: The number of S&P 500 stocks making new lows is higher today than it was during the late October warning, confirming a historic bearish divergence. In parallel, margin debt has exploded past 5% of US GDP. This level of speculative leverage exposes the market to a cascading risk of margin calls at the slightest hint of a correction.
The Hindenburg Signal: The rare Hindenburg Omen technical signal has just triggered simultaneously on both the S&P 500 and the Nasdaq—an event with a historically low success rate for medium-term bulls.
3. The Rotting Foundations of Macroeconomics
The Employment Figure Illusion: The official April headline report showing 115,000 jobs created is a statistical fiction. This number was artificially inflated by the BLS "Birth-Death" model, which added an estimated (and unverified) 391,000 jobs based on assumptions of new business creation. The far more reliable Household Survey shows the exact opposite reality: a loss of 226,000 jobs, marking its third consecutive month of decline.
The Stagflationary Vice (PPI vs. CPI): The Producer Price Index (PPI) delivered a shock by jumping to 6% on a year-over-year basis. Unlike previous inflationary waves, businesses no longer have the pricing power to pass these costs along to consumers whose wage growth has now fallen below the Consumer Price Index (CPI).
Contracting Activity: Both the ISM Services and ISM Manufacturing Employment indices have dipped below the 50% threshold, confirming contraction. Meanwhile, the number of individuals forced into part-time work for economic reasons is surging rapidly toward 5 million in the US.
4. Rapid-Fire Geopolitical and Systemic Risks
The Fed Pivot (The Warsh Effect): The confirmation of Kevin Warsh as the next Fed Chair and the resignation of the central bank's biggest dove, Miran, mark a structural regime shift. Historically, the arrival of a new Fed Chair has almost always triggered a brutal phase of downside and re-adjustment for equity markets.
Global Bond Fracture: Sovereign bond yields are surging dangerously worldwide (the US 10-Year yield spiked 14 basis points in a single session to close near 4.60%), breaking critical technical support levels and threatening to unwind the Yen carry trade in Japan.
The Tech Hype Reversal: The high-profile US-China bilateral trip ended in a quiet failure. Beijing flatly refused Nvidia's puces, proving that their domestic alternatives are advancing and that high-end GPUs are beginning to gather dust on shelves. Donald Trump's passive stance on Taiwan adds a major layer of uncertainty to the semiconductor supply chain.
The Shadow Banking Trap: The $2 trillion private credit market masks a much larger systemic risk—estimated closer to $10 trillion—due to its opaque, interconnected reinsurance structures tied to the life insurance industry.
Conclusion and Strategic Outlook
The convergence of these probabilities points toward an imminent, significant pullback (on the scale of 30-40% for semiconductors and 10-20% for broader tech). The true question is not the correction itself, but whether it triggers a terminal, end-of-cycle bear market or sets a support floor for one final leg up.
In this uncertain environment, the goal is not to panic-sell, but to exercise strict risk management. This is why we are currently focusing on asymmetric options strategies (such as defined Ratio Spreads on the SMH ETF) to protect principal while remaining intelligently positioned.
Video & Timestamps
00:00 - Debunking the BofA "300-Year Anomaly"
01:49 - Elliott Wave Analysis: Are We at the Top?
04:21 - Record Margin Debt & The 5% GDP Warning
05:32 - The 1929 & 2000 Signal: +20% in 4 Weeks
06:15 - Mechanical Markets: Gamma, CTAs, & 401k Inflows
07:20 - Dangerous Concentration: 7 Stocks vs. 493
07:58 - The Hindenburg Omen & Momentum Overshoot
10:06 - IPO Red Flags: CBRS and Exit Liquidity
11:41 - February Forecast Update: Hitting the Wall
12:35 - The Employment Iceberg: BLS Birth-Death Model
15:31 - Temporary Help Divergence & Wage Squeeze
17:31 - PPI Inflation Shock & Demand Destruction
18:46 - ISM Contracting & Part-Time Job Spikes
19:52 - Fed Pivot: Kevin Warsh & Powell Stepping Down
21:11 - Global Debt Crisis & The Failed China Trip
22:44 - The Taiwan Shift & Geopolitical Risk
23:49 - Private Credit & The $10T Insurance Link
25:02 - Weekly Catalysts: Nvidia Earnings & FOMC Minutes
25:46 - Strategy Teaser: Using Ratio Spreads to Limit Risk
29:16 - Conclusion & How to Join the Newsletter
Supports


Nico de Bony
If you found this briefing helpful, feel free to share it. For those ready to build a defensive process, the links to my training are below.
Watch my Free Masterclass to understand the 5 core hedging strategies.
Watch the Practical Demo to see me execute these trades live.
If you want to master this, check out my Self-Paced Course
or apply for one of the few remaining spots in my 1-on-1 Coaching.

![[#5] The Three Hidden "Doom Loops" Wall Street is Desperately Trying to Ignore](https://static.wixstatic.com/media/e03bc3_e7147e1b2a094bbb8ff8b2908f18818a~mv2.png/v1/fill/w_980,h_551,al_c,q_90,usm_0.66_1.00_0.01,enc_avif,quality_auto/e03bc3_e7147e1b2a094bbb8ff8b2908f18818a~mv2.png)
![[#4] Why the Smart Money Has Already Rotated. What Happens Next.](https://static.wixstatic.com/media/e03bc3_4f0eb6116f494113b4ee77197b7f4087~mv2.png/v1/fill/w_980,h_529,al_c,q_90,usm_0.66_1.00_0.01,enc_avif,quality_auto/e03bc3_4f0eb6116f494113b4ee77197b7f4087~mv2.png)