%20-%20WO%20BG.png)
The Failed Weekend "TACO" and the 72-Hour Market Landmine
.jpg/v1/fill/w_320,h_320/file.jpg)
Updated: Jul 29

Opening Note
Welcome to this extra weekly briefing. I am sending this update directly to my email subscribers today because market dynamics are accelerating much faster than usual, and we are entering what could be the most volatile 72-hour window of the summer.
If you were watching the market for the "Weekend TACO" (the running joke that Trump Always Chickens Out), you saw it fail in real time. The market opened green on optimism, only to face an immediate selloff as the bounce completely dissolved. This is a critical pattern break. If political tweets can no longer save the market, who will step in? Certainly not the Federal Reserve, which is far more likely to maintain a hawkish stance (meaning prioritizing higher interest rates to fight inflation rather than cutting rates to support stocks) than offer a safety net.
At the same time, major shockwaves hit semiconductors. Yesterday, Nvidia fell 5% in a single trading session, causing it to lose its spot as the world's most valuable company back to Apple. The NASDAQ made a fresh new low as semiconductors broke key support levels. This breakdown was heavily fueled by China's state-backed memory giant, CXMT, which completed its massive $8.5 billion IPO in Shanghai with an astounding 466% surge on its first day. Coupled with China introducing a new domestic competitor to lithography giant ASML, Western tech dominance is facing unprecedented structural pressure.
To top it off, Wall Street is entering Wednesday’s Fed decision with deep anxiety. I am seeing an increasing number of analysts calling for a surprise rate hike. Whether this is independent analysis or the Fed subtly guiding expectations to minimize panic, it creates a rare "live" Fed decision. When you add the Bank of Japan decision on Thursday evening, the market impact will spill directly into Friday's close.
I put this special briefing together not to tell you a crash is happening right now, but to give you a heads-up on the critical warning signs I am seeing. My goal is to help you navigate this rocky week, make informed decisions, and avoid emotional panic.
Table of Content
Executive Summary
Key catalysts I’m watching for (next 1-2 weeks)
Structural risks (Private Credit Crisis, AI Bubble, Geopolitics, Rapid fire topics)
USA data and events
Canada data and events
Strategic assets (Gold, Silver, Copper, Bitcoin)
Conclusion
Resources and Programs
Executive Summary
Looking strictly at index headlines can give a false sense of security, but beneath the surface, key structural mechanics are beginning to break down rapidly.
The AI trade is unraveling at an accelerated pace across global markets. Overnight, South Korea's Kospi index crashed nearly 11%, leaving it down roughly a third from its peak. Industry leaders have been hit hardest: Samsung has fallen 42% and SK Hynix has dropped 48% from their respective highs. In the US, market accelerators have re-engaged into net negative gamma (a technical condition where market makers are forced to sell into declining prices, accelerating downward momentum), and CTAs (Computer Trading Algorithms) are locked into selling patterns over the coming week and month regardless of market direction. Furthermore, Credit Default Swaps (CDS, which measure the cost to insure against corporate default) have been blowing up since June for major hyperscalers as well as Nvidia. This is a major warning sign because these are massive companies supposed to be rock-solid, yet credit markets are pricing in rapidly escalating default risk.
Corporate balance sheets are confirming these fears. Q2 earnings from Alphabet and Tesla revealed negative free cash flow driven by massive AI infrastructure spending. Headline profit beats were heavily inflated by unrealized paper gains on private startup holdings like SpaceX and Anthropic. Meanwhile, an investigation uncovered $1.65 trillion in off-balance-sheet shadow debt across top tech firms.
Smart money indicators are flashing major late-cycle warnings. US corporate insiders cashed out $77.6 billion in stock during the first half of 2026, selling at an 11.5 to 1 ratio against purchases. Conversely, foreign investors panic-bought over $903 billion in US equities, a pattern that historically aligns with major market tops. In private credit, Wall Street is using complex insurance wrappers to mask risky debt, while top executives are quietly stepping down.
On the macroeconomic front, US weekly jobless claims unexpectedly hit a 60-year low, sparking rate hike fears despite falling manufacturing employment. In Canada, inflation decelerated rapidly with core metrics falling below target, though my analysis suggests that for investors who bought near the peak in Q1 2022, national real estate price indices could take over two decades to break even after adjusting for inflation.
In energy, as expected (see last week's video), Light Crude Oil Futures (CL1!) reached $90 before a pullback, and the divergence between the paper price and the refining crack spread is finally shrinking rapidly. Finally, I provide a quick technical analysis update for Gold, Silver, Copper (where a crowded long trade poses unwind risks), and Bitcoin (where the crowd is dangerously waiting for $50,000 or lower as a certainty).
Key Catalysts
The next two weeks present a sequence of major market catalysts. Position sizes should reflect that this environment is built for unexpected price moves.
Date | Key Event / Release | Strategic Focus |
Wed 07/29 | FOMC Rate Decision + MSFT & META Earnings | Live Fed policy stance + cloud capex and free cash flow |
Thu 07/30 | US Q2 GDP + June PCE + AAPL & AMZN Earnings + BoJ Decision | Economic growth, inflation metrics, tech results, and BoJ stance |
Fri 07/31 | Canada Monthly GDP Print + Market Reaction to BoJ | Domestic growth trends + global digesting of BoJ decision |
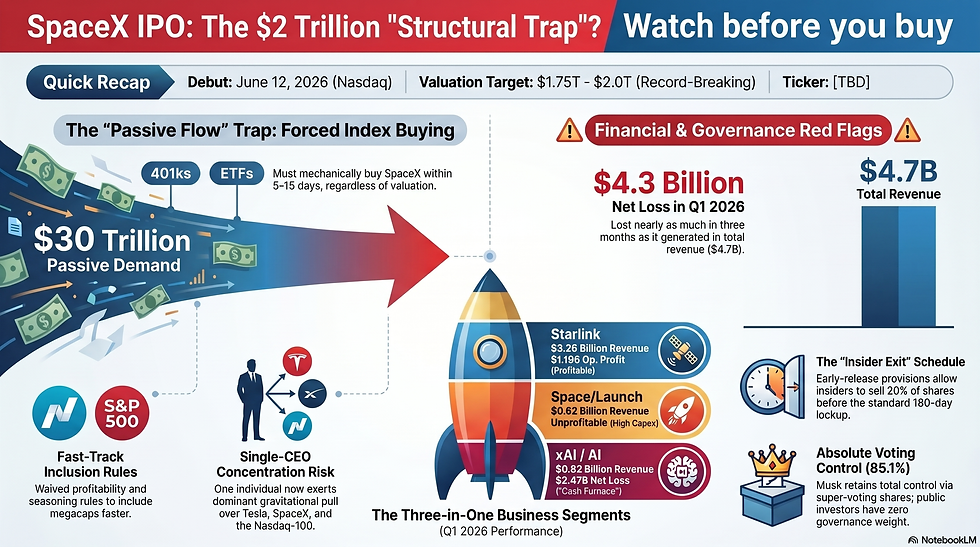
Thu 08/06 | SPCX Earnings + ~911M Insider Share Lockup Unlock | First post-IPO earnings + major insider share unlock |

My Take on the Fed at FOMC:
I do not expect the Federal Reserve to hike interest rates at this meeting. Instead, I expect the Fed to deliver a strongly hawkish message.
They will likely set the stage to hike rates in September if incoming economic data demands it.
Fed officials likely already have early access to the June PCE deflator data that drops on Thursday.
A quick note on the PCE deflator: even though it is officially the Fed's preferred inflation gauge, it is not a metric Fed chair Kevin Warsh considers reliable or take too seriously, as in his view no current official government metric accurately reflects real inflation.
A quick note on market behavior this earnings season: companies missing expectations are getting penalized far harder than usual, dropping an average of 4.2% on a miss compared to the historical norm of 2.9%.Structural Risks

Structural Risks
Private Credit Crisis
Shadow banking and private credit continue to display late-cycle stress that warrants close monitoring.


Wall Street investment firms are actively using insurance guarantees to transform illiquid, hard-to-rate private credit fund stakes into investment-grade bonds. Think of it like taking a box of processed junk food, placing an organic label on the packaging, and suddenly getting permission to place it on health food store shelves. The underlying product did not get healthier, but the new label allowed it to bypass strict quality rules.
By placing an insurance wrapper on risky debt, institutional buyers can drastically reduce the regulatory capital reserves they are legally required to hold. An A-rated wrapped tranche requires less than 1% in capital reserves compared to up to 30% for a direct investment.
The problem is that the life insurance companies backing these deals are operating with extreme balance sheet leverage, often 90 to 100 times their equity buffers. Their portfolios are filled with illiquid Level 3 assets that lack daily market price discovery. If small business default rates rise even moderately, these razor-thin equity buffers could be completely wiped out.
Adding to this quiet tension, Jonathan Bock, the Co-CEO of Blackstone Private Credit, actually resigned on Monday of last week. However, the announcement was quietly released late on Friday evening when nobody was paying attention. When major firms bury executive departures during off-hours, it is a clear sign that internal portfolio revaluations are underway.

Financial Markets and the AI Bubble
The artificial intelligence financial bubble is showing severe signs of structural fatigue, with key technical and credit indicators breaking down simultaneously.

International Unraveling and Market Mechanics
South Korea Crash: The AI trade unraveled rapidly overnight as South Korea's Kospi index dropped nearly 11%. The Kospi is now down roughly a third from its peak, with Samsung down 42% and SK Hynix falling 48%.
Semiconductor Breakdown: The NASDAQ made a fresh low yesterday as semiconductors broke support. Nvidia fell 5% in a single day, allowing Apple to pass it in market cap. Despite heavy volume, true capitulation is not yet visible, meaning the low for semiconductors is likely not in.
Net Negative Gamma & CTA Selling: Market accelerators have re-engaged into net negative gamma (where market makers are forced to sell as prices fall), and Computer Trading Algorithms (CTAs) are locked into selling patterns over the coming week and month regardless of market direction.
Credit Default Swaps (CDS) Spikes: CDS spreads have been blowing up since June across major hyperscalers, including Oracle and Nvidia. This signals that credit markets are pricing in rising default risks for companies long assumed to be rock-solid. If Oracle receives one more credit downgrade, its $140 billion in corporate bonds will fall into junk status, forcing institutional investment-grade funds to liquidate.
CXMT Memory IPO: China's state-backed memory maker CXMT launched its $8.5 billion IPO on Shanghai's STAR Market, surging 466% on day one. CXMT's expansion directly challenges the global DRAM cartel (Samsung, SK Hynix, Micron), which currently controls 90% of global revenue.


Corporate Earnings Reality and Insider Activity
Paper Gain Distortions: Headline profits for Alphabet and Tesla were heavily distorted by non-operational accounting adjustments. 87% ($6.26 of $9.11 EPS) of Alphabet’s net income derived from unrealized paper markups on private startup holdings like Anthropic and SpaceX. Stripping out these items reveals core operating net income grew just 2% quarter-over-quarter. Similarly, $1.005 billion of Tesla’s $1.11 billion GAAP net income came from its SpaceX valuation markup, while free cash flow turned negative.
Memory Inflation Masking Real Volume: High Bandwidth Memory prices surged up to 370% year-over-year, accounting for ~25% of recent capex increases at Microsoft. As a result, flat physical hardware deployment is being obscured by component price inflation.
Hidden Shadow Debt ($1.65 Trillion): An investigation revealed $1.65 trillion in off-balance-sheet commitments across Alphabet, Microsoft, Amazon, Meta, and Oracle, exceeding their $1.35 trillion in officially reported debt.
Historic Insider Selling: Corporate executives unloaded $77.6 billion in company stock during the first half of 2026 against just $6.9 billion in purchases. This 11.5-to-1 sell-to-buy ratio represents the second-largest half-year insider cash-out spree in over two decades.


Geopolitics Affecting Financial Markets
Military tensions in the Middle East continue to disrupt energy transit channels. Commercial shipping through the Strait of Hormuz remains severely constrained, driving Light Crude Oil Futures (CL1!) up toward $90 per barrel before experiencing a temporary pullback.
As raw crude costs rose faster than refined fuel prices, the divergence between paper crude prices and the refining crack spread is finally shrinking rapidly.

Meanwhile, the US Strategic Petroleum Reserve sits at just 43 days of supply compared to its 65-day average. A recent Department of Energy offer to release 40 million barrels saw bidders take only 500,000 barrels due to physical pipeline constraints at Big Hill and Bryan Mound.
Rapid Fire Topics and Additional Market Updates
China ASML Competitor: China has officially introduced a domestic competitor to lithography giant ASML, further threatening Western tech market share.
China Tech ETF Inflow: The Chinese government injected $2 billion USD (13.8 billion Yuan) into its primary semiconductor ETF, marking its largest single-day inflow on record.
Margin Debt Unwind: Chinese retail investors are unwinding stock margin debt at the fastest pace in ten years.
Low S&P 500 Volume: Recent S&P 500 advances occurred on very low trading volume, falling below levels seen during the June peak.
USA Data and Events
US economic indicators presented a split picture of labor strength alongside manufacturing weakness.
Weekly initial jobless claims unexpectedly dropped to 187,000, touching a 60-year low. Stock markets reacted nervously as bond yields rose, fearing the Federal Reserve would use tight labor numbers to justify higher interest rates.

However, looking beneath the headline number provides essential context:
Initial claims represent a single one-week data point.
The 4-week moving average declined far more modestly from 214,750 to 207,500.
Continuing claims remained virtually flat at 1.796 million.
Structural labor shifts show more workers transitioning into gig-economy work rather than filing state unemployment claims.
Meanwhile, manufacturing surveys showed the sharpest drop in employment since May 2020, and the Atlanta Fed downgraded its Q2 real GDP growth estimate down to 1.7%.
Canada Data and Events
Canadian economic data highlighted domestic economic weakness alongside notable disinflation progress.
Headline CPI dropped from 3.2% in May to 2.8% in June, marking a -0.4% monthly decline. Crucially, the Bank of Canada's preferred core metrics (CPI-Median and CPI-Trimmed Mean) both fell below the 2.0% policy target.
May retail sales rose 1.0% on paper, but real volume growth was weak at just 0.3%, with dollar gains driven almost entirely by higher gas pump prices.
In real estate, homeowner housing starts for single-family units and condos dropped to 1997 lows. Pre-sale condo markets in major cities have stalled, with Metro Vancouver recording just 62 pre-sale units sold in Q2 and default rates reaching 10% to 20%. Developers pivoted toward purpose-built rentals backed by CMHC financing, pushing rental builds to a record high of 218,000 units under construction.
Based on my reading of historical market models, for investors who bought near the peak in Q1 2022, after adjusting for inflation, national real estate price indices could take over two decades to break even. Keep in mind that this national index represents a general macro trend and does not reflect specific local market dynamics.

Strategic Assets (Gold, Silver, Copper, Bitcoin)
Gold
Market News: CME Group launched 24/7 perpetual 1-ounce gold futures on July 24, right as Chinese state banks ended retail paper gold accounts to direct domestic buyers toward physical settlement on the Shanghai Gold Exchange.
Technical Analysis: Gold continues to compress inside a large symmetrical wedge. Price sits within a key Fibonacci retracement zone anchored from its major advance that began in February 2024. Daily charts display a bullish RSI divergence on light volume. Gold trades below its 20, 50, and 200-day moving averages.
Silver
Technical Analysis: Silver is consolidating inside a narrowing wedge structure, mirroring gold. Daily momentum shows a bullish RSI divergence on low volume, while price remains below key moving averages awaiting a confirmed breakout.
Copper
Trade Warning: Copper has become an extremely crowded trade, with net long positions reaching a 5-year high. In simple terms for non-technical investors: when a trade is "crowded," it means almost everyone who wants to buy has already bought. When net long positions hit extreme levels, there are very few buyers left to push prices higher. All it takes is a single match or negative catalyst to trigger a panic selloff as everyone tries to exit the same narrow door at once.
Bitcoin
Key On-Chain Levels:
Short-Term Holder Cost Basis: $69,000 (Overhead resistance zone)
Current Consolidation Zone: $63,000 (Key pivotal level with recent price swings)
Median Price Shelf: $63,000 (Heavy structural demand cluster)
Realized Price Floor: $53,000 (Macro cycle structural floor)
Overhead Supply Clusters: Concentrated around $63,000 and $84,000
On-Chain & Sentiment Outlook: Widespread market expectations are calling for, or worse, waiting for a drop to $50,000 or lower as a certainty. When retail traders act like a further drop is guaranteed, it often indicates the local bottom is already in, as markets rarely reward consensus waiting. On-chain metrics confirm a regime shift from Capitulation to Accumulation. Spot US ETF flows flipped positive, while derivatives leverage has reset to balanced levels.
Technical Analysis: Bitcoin has been moving up and down around the key $63,000 level. The recent local low touched the 61.8% Fibonacci retracement level of the macro cycle move. The 20-day and 50-day moving averages formed a bullish crossover, while the 200-day moving average continues to trend downward overhead.
Conclusion
I hope this special weekly update helped you be more prepared for the likely market volatility and pullback. I find that even when the market goes down, it is easier to go with the flow when we understand what happened and why it likely happened.
If you liked this format, simply send me a message to let me know!

Nico de Bony
Resources and Programs
Want to go further?
Discover OPTI Strategies’ resources and programs to build a more rigorous investment process:
Free Masterclass : Understand five fundamental portfolio protection strategies.
Pratical Demonstration : See these strategies applied in practice.
Self-Paced Courses : Learn at your own pace through a structured curriculum.
Private Programs : Receive personalized support to improve your decision-making and risk-management process.